FnuPlot Cross-platform charting with gnuplot
There is a bunch of visualization and charting libraries for F#. Sadly, perhaps the most advanced one, F# Charting, does not work particularly well outside of Windows at the moment. There are also some work-in-progress libraries based on HTML like Foogle Charts and FsPlot, which are cross-platform, but not quite ready yet.
Before Christmas, I got a notification from GitHub about a pull request for a simple gnuplot wrapper that I wrote a long time ago (and which used to be carefully hidden on CodePlex).
The library is incomplete and I don't expect to dedicate too much time to maintaining it, but it works quite nicely for basic charts and so I though I'd add the ProjectScaffold structure, do a few tweaks and make it available as a modern F# project.
- FnuPlot documentation & web site
- Get FnuPlot from Nuget or use Paket GitHub dependency
- FnuPlot source code on GitHub
Introducing FnuPlot
FnuPlot is a simple DSL for composing charts. In some ways, it is similar to F# Charting, but it has a few specific aspects that are designed based on how gnuplot works.
Assuming you already have FnuPlot referenced from NuGet, you can start by
creating a new instance of GnuPlot (this is IDisposable and the Dispose method
stops the underlying gnuplot process). The constructor takes a full path to
gnuplot as an argument, in case this is not available in your PATH:
1: 2: 3: 4: 5: 6: |
|
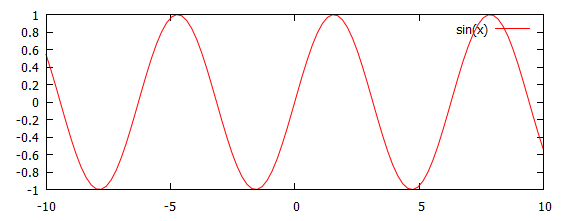
To create charts, you can now use gp.Plot. This has a couple of overloads. The
most basic one just takes a string with the function you want to plot:
1:
|
|
If you want to create charts based on data calculated in F#, then you'll need to
use a type called Series. This provides static methods for creating various kinds
of series (lines, histograms, ...). The following creates a line series from X and Y
values and a function series with additional configuration:
1: 2: 3: 4: 5: 6: 7: 8: 9: |
|
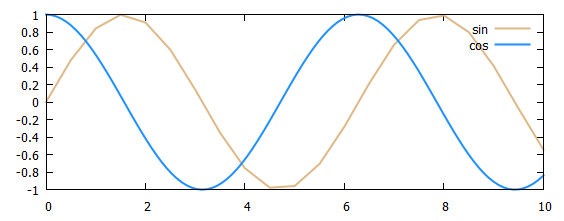
Here, we're using an overload of gp.Plot that takes a single series. You can also
call it with a sequence of series, to combine multiple lines into a single chart.
The following combines the simple function chart with a (not very smooth) line generated using an F# list comprehension:
1: 2: 3: 4: 5: 6: 7: |
|
Here, we're calling gp.Plot with the pipeline operator and we only specified the data.
However, the gp.Plot method has a number of other optional parameters that can be used
to configure how the chart looks. You can, for example, specify the range:
1: 2: 3: 4: 5: 6: 7: 8: 9: |
|
The DSL for specifying ranges is using F# range expressions, which is a nice trick (it does not actually generate a range!) and you can read more about it in the documentation.
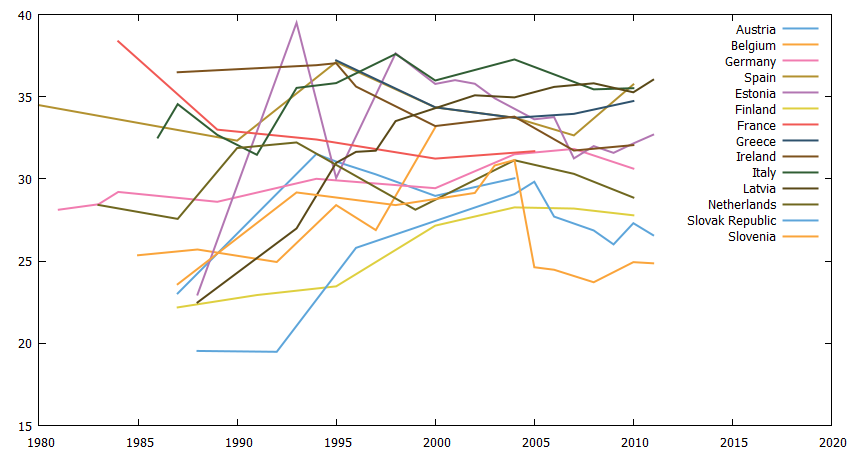
Visualizing WorldBank data
To look at a larger example, I'm going to use the usual WorldBank type provider from F# Data and create a chart showing inequality using the GINI index for the countries of the Eurozone (paying with Euro).
First, let's generate some colours for the lines of the chart. The following snippet uses a couple of pre-defined colours and than adds a darker version to the palette:
1: 2: 3: 4: 5: 6: 7: 8: 9: 10: 11: 12: 13: |
|
If you're a gnuplot expert, you can configure the palete directly. The gp object provides
a method gp.SendCommand where you can send arbitrary command to gnuplot. Here, we're
going to specify colours explicitly using the lineColor parameter.
Now, we want to iterate over all countries in a specified region, get the GINI index
values and construct a list of Series.XY charts that can then be passed to gp.Plot.
The whole snippet looks as follows:
1: 2: 3: 4: 5: 6: 7: 8: 9: 10: 11: 12: 13: 14: 15: 16: |
|
One last interesting thing demonstrated by the above snippet is the gp.Set function.
You can use this to configure a number of properties globally, for all subsequent charts.
Looking for contributors!
This article shows a couple of things that you can do with the current FnuPlot library. However, as I mentioned before, the library is really a fairly simple prototype that I implemented a long time ago. I think using gnuplot is a good way to get nice cross-platform charts, so I did a bit more work and turned it into a proper F# project under the fsprojects GitHub organization. But there is a lot that needs to be done if we want to support all of gnuplot. So if you're interested, start discussions & send pull requests for FnuPlot on GitHub!
Full name: Fnuplot.path
Full name: Fnuplot.path_win
Full name: Fnuplot.path_nix
Full name: Fnuplot.gp
type GnuPlot =
interface IDisposable
new : ?path:string -> GnuPlot
private new : actualPath:string -> GnuPlot
member private Dispose : disposing:bool -> unit
override Finalize : unit -> unit
member Plot : data:seq<Series> * ?style:Style * ?range:Range * ?output:Output * ?titles:Titles -> unit
member Plot : data:Series * ?style:Style * ?range:Range * ?output:Output * ?titles:Titles -> unit
member Plot : func:string * ?style:Style * ?range:Range * ?output:Output * ?titles:Titles -> unit
member SendCommand : str:string -> unit
member Set : ?style:Style * ?range:Range * ?output:Output * ?titles:Titles * ?TimeFormatX:TimeFormatX -> unit
...
Full name: FnuPlot.GnuPlot
--------------------
new : ?path:string -> GnuPlot
member GnuPlot.Plot : data:Series * ?style:Style * ?range:Internal.Range * ?output:Output * ?titles:Titles -> unit
member GnuPlot.Plot : func:string * ?style:Style * ?range:Internal.Range * ?output:Output * ?titles:Titles -> unit
type Series =
new : plot:string * data:Data * ?title:string * ?lineColor:Color * ?weight:int * ?fill:FillStyle -> Series
member Command : string
member Data : Data
static member Function : func:string * ?title:string * ?lineColor:Color * ?weight:int * ?fill:FillStyle -> Series
static member Histogram : data:seq<float> * ?title:string * ?lineColor:Color * ?weight:int * ?fill:FillStyle -> Series
static member Lines : data:seq<float> * ?title:string * ?lineColor:Color * ?weight:int -> Series
static member TimeY : data:seq<DateTime * float> * ?title:string * ?lineColor:Color * ?weight:int -> Series
static member XY : data:seq<float * float> * ?title:string * ?lineColor:Color * ?weight:int -> Series
Full name: FnuPlot.Series
--------------------
new : plot:string * data:Data * ?title:string * ?lineColor:Color * ?weight:int * ?fill:FillStyle -> Series
Full name: Microsoft.FSharp.Core.Operators.sin
struct
member A : byte
member B : byte
member Equals : obj:obj -> bool
member G : byte
member GetBrightness : unit -> float32
member GetHashCode : unit -> int
member GetHue : unit -> float32
member GetSaturation : unit -> float32
member IsEmpty : bool
member IsKnownColor : bool
...
end
Full name: System.Drawing.Color
Full name: Fnuplot.series
Full name: FnuPlot.Ranges.Range
Full name: Fnuplot.coreColors
Base colors converted from HTML format
from Microsoft.FSharp.Collections
Full name: Microsoft.FSharp.Collections.Seq.map
static member FromHtml : htmlColor:string -> Color
static member FromOle : oleColor:int -> Color
static member FromWin32 : win32Color:int -> Color
static member ToHtml : c:Color -> string
static member ToOle : c:Color -> int
static member ToWin32 : c:Color -> int
Full name: System.Drawing.ColorTranslator
Full name: Fnuplot.allColors
Infinite sequence with core colors followed by
a darker version and then repeated recursively
val seq : sequence:seq<'T> -> seq<'T>
Full name: Microsoft.FSharp.Core.Operators.seq
--------------------
type seq<'T> = System.Collections.Generic.IEnumerable<'T>
Full name: Microsoft.FSharp.Collections.seq<_>
Color.FromArgb(alpha: int, baseColor: Color) : Color
Color.FromArgb(red: int, green: int, blue: int) : Color
Color.FromArgb(alpha: int, red: int, green: int, blue: int) : Color
val int : value:'T -> int (requires member op_Explicit)
Full name: Microsoft.FSharp.Core.Operators.int
--------------------
type int = int32
Full name: Microsoft.FSharp.Core.int
--------------------
type int<'Measure> = int
Full name: Microsoft.FSharp.Core.int<_>
namespace FSharp
--------------------
namespace Microsoft.FSharp
namespace FSharp.Data
--------------------
namespace Microsoft.FSharp.Data
Full name: Fnuplot.wb
static member GetDataContext : unit -> WorldBankDataService
nested type ServiceTypes
Full name: FSharp.Data.WorldBankData
Full name: Fnuplot.euro
Full name: FnuPlot.Ranges.RangeX
Full name: Microsoft.FSharp.Collections.Seq.zip
val float : value:'T -> float (requires member op_Explicit)
Full name: Microsoft.FSharp.Core.Operators.float
--------------------
type float = System.Double
Full name: Microsoft.FSharp.Core.float
--------------------
type float<'Measure> = float
Full name: Microsoft.FSharp.Core.float<_>
Published: Thursday, 15 January 2015, 5:58 PM
Author: Tomas Petricek
Typos: Send me a pull request!
Tags: f#, fslab, data science