Better F# data science with FsLab and Ionide
At NDC Oslo 2016, I did a talk about some of the recent new F# projects that are making data science with F# even nicer than it used to be. The talk covered a wider range of topics, but one of the nice new thing I showed was the improved F# Interactive in the Ionide plugin for Atom and the integration with FsLab libraries that it provides.
In particular, with the latest version of Ionide for Atom and the latest version of FsLab package, you can run code in F# Interactive and you'll see resulting time series, data frames, matrices, vectors and charts as nicely pretty printed HTML objects, right in the editor. The following shows some of the features (click on it for a bigger version):
In this post, I'll write about how the new Ionide and FsLab integration works, how you can use it with your own libraries and also about some of the future plans. You can also learn more by getting the FsLab package, or watching the NDC talk:
-
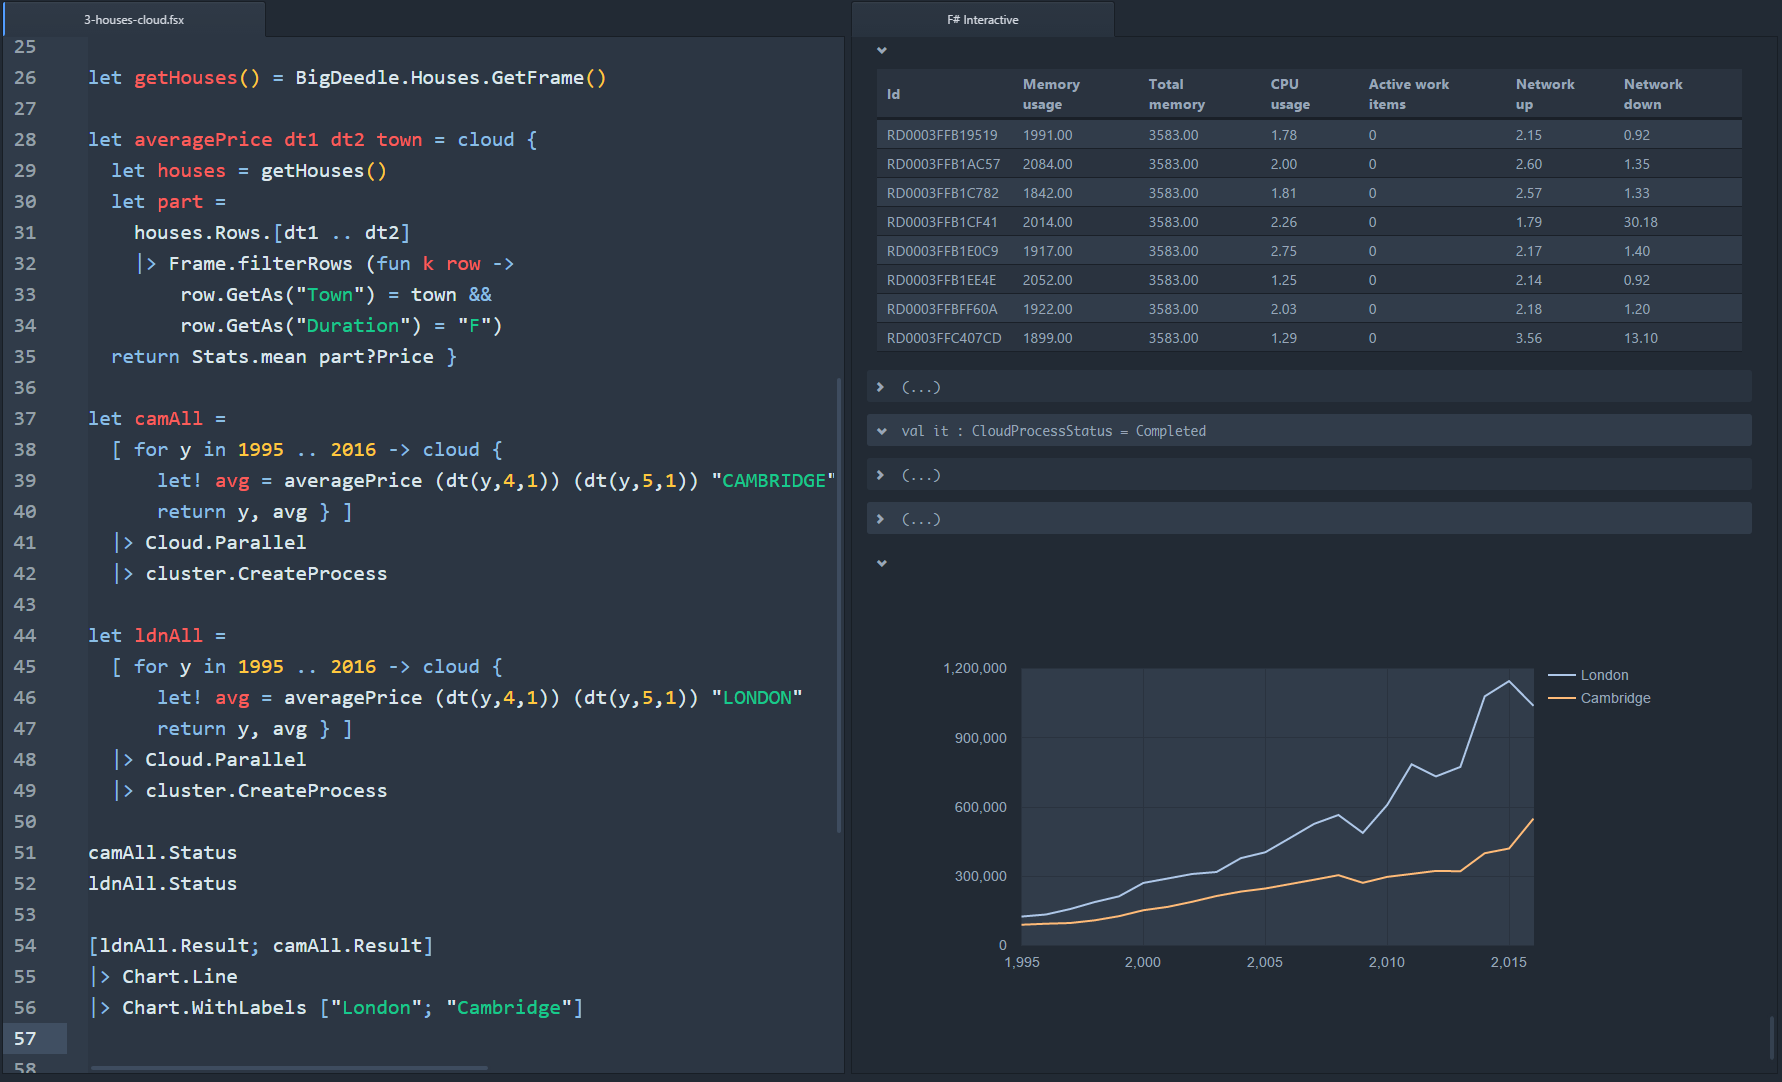
Analysing Big Time-series Data in the Cloud is my NDC Oslo 2016 talk. It shows the new Ionide + FsLab integration, but also uses BigDeedle and MBrace to interactively process large data in the cloud.
-
FsLab downloads page has templates that you can download to get started. Just install Atom with Ionide, download the FsLab basic template and you're good to go!
-
For more background on FsLab as well as additional examples, check out my FsLab announcement from last year. This explains what is (and is not) FsLab, how you can contribute and much more.
FsLab formatters for Ionide
FsLab is just a NuGet package that references a number of other F# packages for doing data science with F#. The one thing that it adds is an easy to use load script that you can use to load all the packages from F# interactive. This means that when you download the template, the sample script file starts with something like this:
1: 2: 3: 4: 5: 6: 7: |
|
The first line loads a default theme that configures how embedded charts and tables will be formatted. It sets things like float formatting options, colours, fonts etc. You can find and contribute themes in the FsLab.Formatters repository - the current choice covers only one white and one dark theme for Atom. The second line is the more important one, which loads the FsLab dependencies.
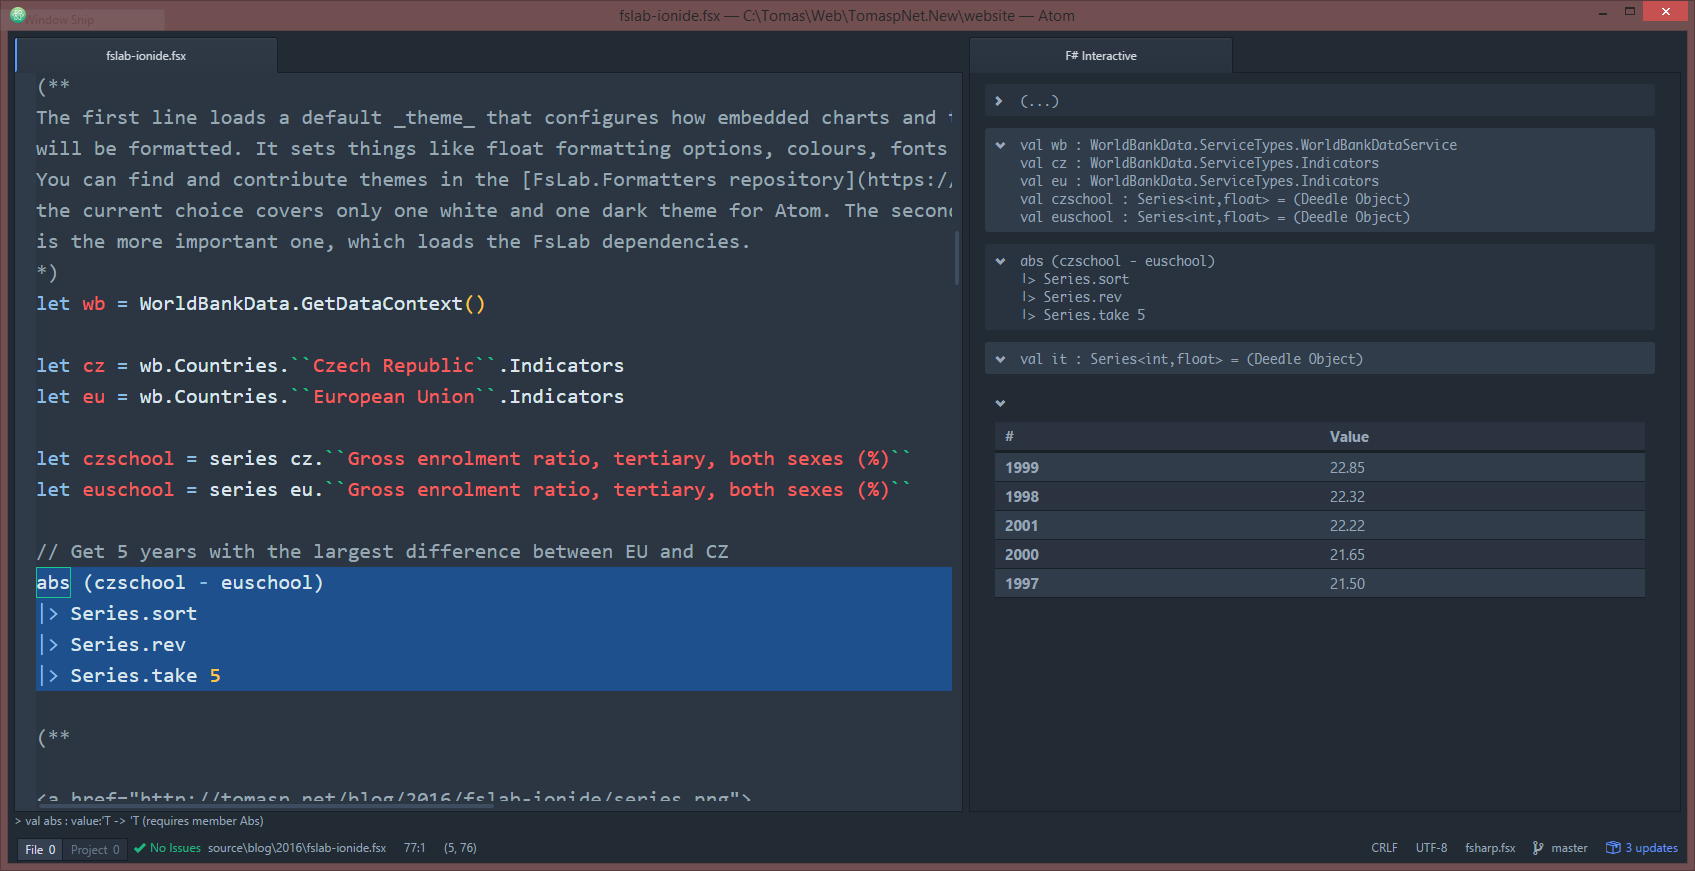
The basic template comes with a minimal example that downloads two time series from the World Bank and finds the years when they were the most different:
1: 2: 3: 4: 5: 6: 7: 8: 9: 10: 11: 12: 13: |
|
When you run the code in Atom, a formatter for Deedle series should make it easy
to see the result of the last expression - make sure to run the last 4 lines of
the snippet as a separate interaction. Ionide will only show the formatted object
if the formattable object is the result of the snippet. Alternatively, you can also
select czschool or euschool and run Alt+Enter to see one of the source series:
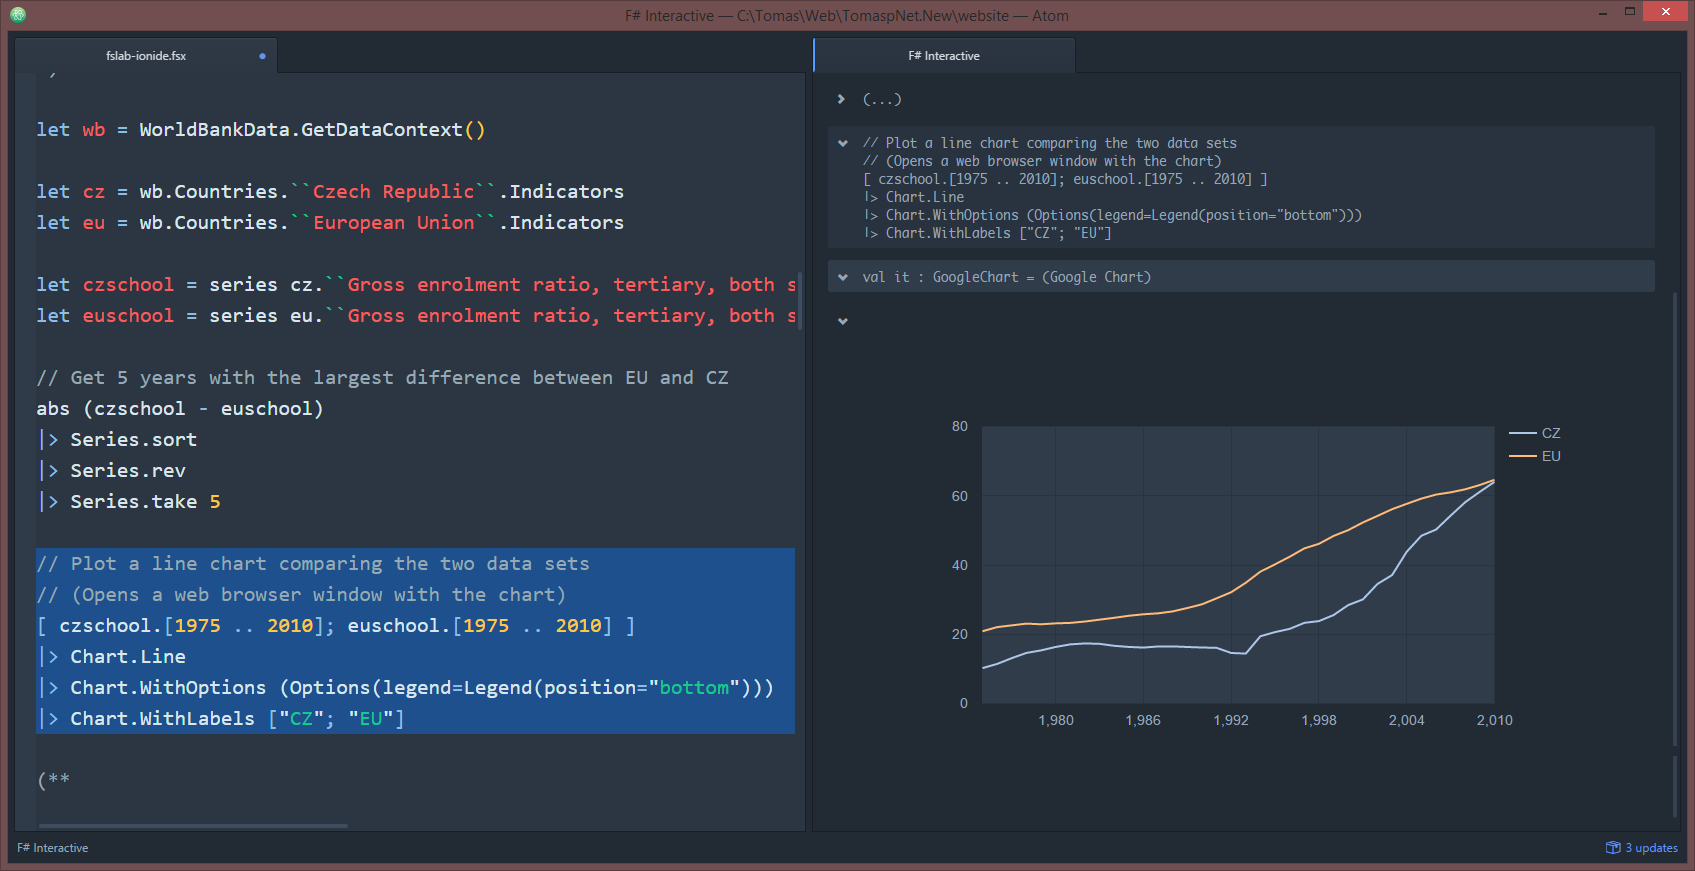
Aside from Deedle series, the FsLab package registers formatters for the charting libraries that it comes with. This includes F# Charting (Windows-only), XPlot Google charts and also XPlot Plotly charts. The following example plots the two time-series using the XPlot wrapper for Google charts:
1: 2: 3: 4: |
|
The Google chart is formatted according to the theme that we loaded on the first line of the script, so it looks nicely integrated with the F# Interactive window (but as I mentioned, we need your help with adding more than just the two standard Atom themes).
One of the nice aspects of how the FsLab and Ionide integration works is that it is not ad-hoc integration for just a couple of selected libraries - quite the opposite! All the FsLab formatters live in a separate repository from Ionide and you can create your own formatters that will work in exactly the same way. The following section has more details about the underlying mechanism behind all this.
Creating custom HTML formatters
The latest release of ionide-fsi, which is the F# Interactive
plugin for Atom no longer runs fsi.exe in the background (like Visual Studio or all other editors),
but instead it is based on the brand new FsInteractiveService.
This is a light-weight server that wraps the F# Interactive functionality. It can be consumed by any
editor via HTTP and it exposes API for evaluating F# code
but also for getting autocompletion and other hints.
The FsInteractiveService extends the standard F# Interactive functionality with the ability to format
objects as HTML. The idea is very simple. You
call fsi.AddHtmlPrinter and specify a function that turns your object into an HTML string! When you
evaluate an expression that returns a value that has a registered formatter, Ionide will then display
it using your provided HTML formatter.
Creating HTML formatter for tables
As a basic example, say you have a type that represents a table:
1:
|
|
Now, we want to create a HTML formatter that will render the table as a <table> element. To do
this, all you need is to call fsi.AddHtmlPrinter. The FsInteractiveService also defines a
symbol HAS_FSI_ADDHTMLPRINTER and so it is a good idea to wrap the following code in a big
#if HAS_FSI_ADDHTMLPRINTER block - this way, the code will be compatible with F# Interactive in
Visual Studio and other editors that do not support HTML formatters (yet).
1: 2: 3: 4: 5: 6: 7: 8: 9: 10: 11: 12: |
|
The result of the formatter function is actually seq<string * string> * string. The tuple consists
of two things:
-
The second element is the HTML body that represents the formatted value. Typically, editors will embed this into HTML output.
-
A sequence of key value pairs that represents additional styles and sripts used that are required by the body. The keys can be
styleorscript(or other custom keys supported by editors) and can be treated in a special way by the editors (e.g. loading JavaScript dynamically in Atom requires placing the HTML content in an<iframe>`).
You can now define a table as follows:
1: 2: 3: 4: |
|
In the current version, the value is only formatted when Table is returned as a direct result
of an expression. This means that you need to evaluate an expression of type Table rather than,
for example, a value binding as above:
1:
|
|
When you run the above in Atom, you will see a table formatted as HTML <table> element. (Some
more styling is needed to actually make this pretty, but this is a good start. Oh and did you
know that Atom supports the <marquee> tag?!)
Themes, parameters and servers
In practice, there are a few other concerns that make formatting objects as HTML harder. For
example, some of the HTML formatters can implement lazy loading where they use a simple web server
running in the background to provide data to the view (which calls the server using JavaScript).
Also, it is nice if all the HTML formatters can share the same visual theme. To make these
possible, the FsInteractiveService also defines fsi.HtmlPrinterParameters which is a global
value of type IDictionary<string, obj> that can be used for storing various shared configuration.
For example, the html-standalone-output parameter specifies whether the generated HTML code
should be stand-alone, or whether it is allowed to use JavaScript to load data lazily (the latter
is used for Deedle frames in the talk and it means you can scroll through the data, but you need
to hava a server running in the background):
1: 2: 3: 4: |
|
There are a couple of examples of how this dictionary can be used in the standard FsLab formatters:
-
The
DefaultWhite.fsxfile shows the different kind of parameters that you can specify for default FsLab formatters. You can copy & edit it to create new visual styles for FsLab (and send a PR to FsLab.Formatters if they correspond to a common Atom theme!) -
The XPlot formatter in
XPlot.fsis a good example of a formatter that reads the above visual styles and uses it to customize the look of the HTML it generates. -
The Deedle formatter in
Deedle.fsuses a lightweight Suave server running in the background to load data from a frame or series on demand. This is a good example of a more sophisticated formatter.
FsLab Journal and looking ahead
Formatting in FsLab journals
The FsLab downloads page also lets you download a FsLab Journal template. This is something that has been available in FsLab for longer time, but I never wrote much about it. The summary is:
FsLab Journal lets you turn your F# scripts consisting of F# code snippets and Markdown formatted comments into a nice HTML report.
When you download the template, you can just run build run and your script will be turned into
a HTML report in the background. When you change your script, the background runner will upadate
and reload your report. If you want to produce stand-alone HTML (that does not require background
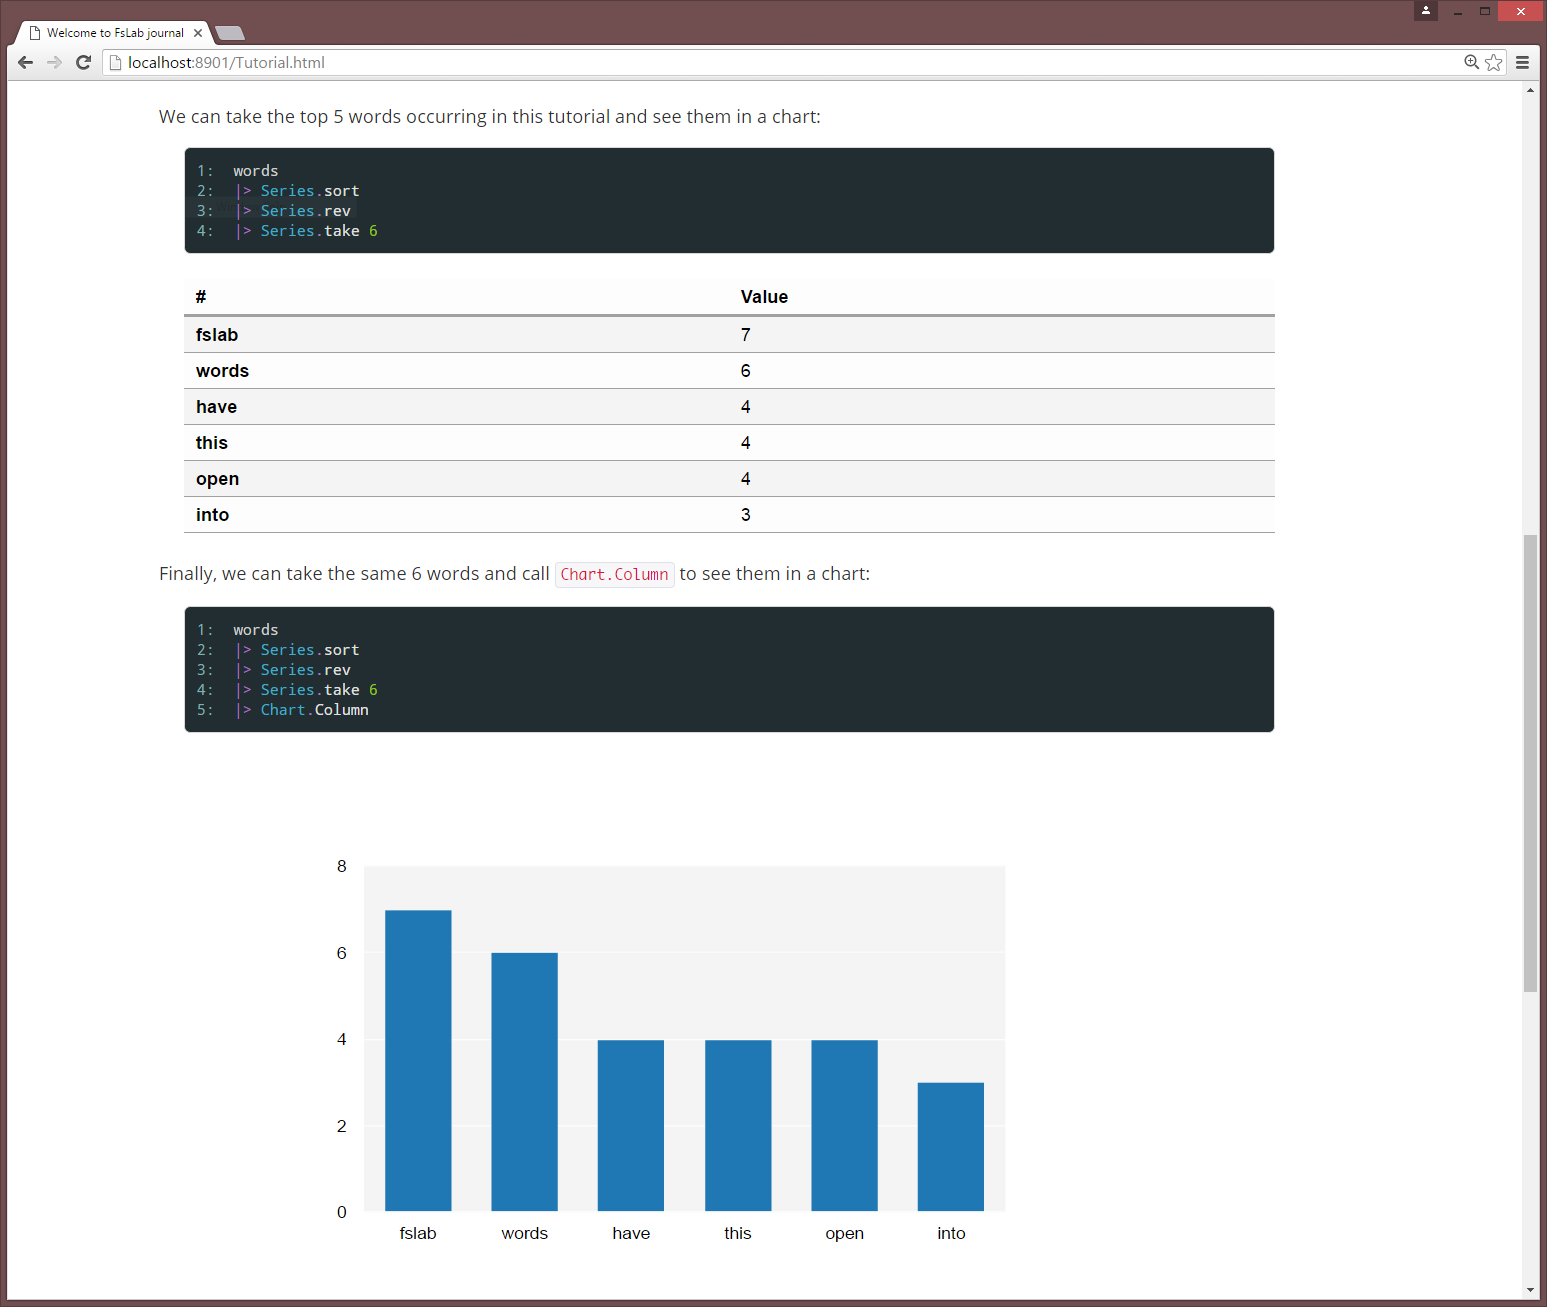
server), you can run build html. The following is an opened journal, running on my machine.
In the latest version of FsLab, the formatting for journals is based on
the same fsi.AddHtmlPrinter formatters. This means we get to reuse the code for it, but most
importantly, when your write your own formatter, it will work with both Ionide and also with
FsLab journals.
Formatting in Jupyter notebooks
One of the related projects in the F# and data science space is the F# bindings for Jupyter
Notebooks. This does not yet use the same model for
registering HTML formatters via fsi.AddHtmlPrinter. Instead, it has its own mechanism for
registering printers,
but I expect that it will be possible to merge the two so that you can just write fsi.AddHtmlPrinter
once and use it in Ionide, FsLab Journals as well as Jupyter.
namespace FSharp
--------------------
namespace Microsoft.FSharp
namespace FSharp.Data
--------------------
namespace Microsoft.FSharp.Data
from XPlot.GoogleCharts
Full name: Fslab-ionide.wb
static member GetDataContext : unit -> WorldBankDataService
nested type ServiceTypes
Full name: FSharp.Data.WorldBankData
<summary>Typed representation of WorldBank data. See http://www.worldbank.org for terms and conditions.</summary>
Full name: Fslab-ionide.cz
Full name: Fslab-ionide.eu
Full name: Fslab-ionide.czschool
Full name: Deedle.F# Series extensions.series
Full name: Fslab-ionide.euschool
Full name: Microsoft.FSharp.Core.Operators.abs
module Series
from Deedle
--------------------
type Series =
new : ?type:string -> Series
member ShouldSerializeannotations : unit -> bool
member ShouldSerializeareaOpacity : unit -> bool
member ShouldSerializecolor : unit -> bool
member ShouldSerializecurveType : unit -> bool
member ShouldSerializefallingColor : unit -> bool
member ShouldSerializelineWidth : unit -> bool
member ShouldSerializepointShape : unit -> bool
member ShouldSerializepointSize : unit -> bool
member ShouldSerializerisingColor : unit -> bool
...
Full name: XPlot.GoogleCharts.Configuration.Series
--------------------
type Series<'K,'V (requires equality)> =
interface IFsiFormattable
interface ISeries<'K>
new : pairs:seq<KeyValuePair<'K,'V>> -> Series<'K,'V>
new : keys:'K [] * values:'V [] -> Series<'K,'V>
new : keys:seq<'K> * values:seq<'V> -> Series<'K,'V>
new : index:IIndex<'K> * vector:IVector<'V> * vectorBuilder:IVectorBuilder * indexBuilder:IIndexBuilder -> Series<'K,'V>
member After : lowerExclusive:'K -> Series<'K,'V>
member Aggregate : aggregation:Aggregation<'K> * observationSelector:Func<DataSegment<Series<'K,'V>>,KeyValuePair<'TNewKey,OptionalValue<'R>>> -> Series<'TNewKey,'R> (requires equality)
member Aggregate : aggregation:Aggregation<'K> * keySelector:Func<DataSegment<Series<'K,'V>>,'TNewKey> * valueSelector:Func<DataSegment<Series<'K,'V>>,OptionalValue<'R>> -> Series<'TNewKey,'R> (requires equality)
member AsyncMaterialize : unit -> Async<Series<'K,'V>>
...
Full name: Deedle.Series<_,_>
--------------------
new : ?type:string -> Series
--------------------
new : pairs:seq<System.Collections.Generic.KeyValuePair<'K,'V>> -> Series<'K,'V>
new : keys:seq<'K> * values:seq<'V> -> Series<'K,'V>
new : keys:'K [] * values:'V [] -> Series<'K,'V>
new : index:Indices.IIndex<'K> * vector:IVector<'V> * vectorBuilder:Vectors.IVectorBuilder * indexBuilder:Indices.IIndexBuilder -> Series<'K,'V>
Full name: Deedle.Series.sort
Full name: Deedle.Series.rev
Full name: Deedle.Series.take
static member Annotation : data:seq<#seq<DateTime * 'V * string * string>> * ?Labels:seq<string> * ?Options:Options -> GoogleChart (requires 'V :> value)
static member Annotation : data:seq<DateTime * #value * string * string> * ?Labels:seq<string> * ?Options:Options -> GoogleChart
static member Area : data:seq<#seq<'K * 'V>> * ?Labels:seq<string> * ?Options:Options -> GoogleChart (requires 'K :> key and 'V :> value)
static member Area : data:seq<#key * #value> * ?Labels:seq<string> * ?Options:Options -> GoogleChart
static member Bar : data:seq<#seq<'K * 'V>> * ?Labels:seq<string> * ?Options:Options -> GoogleChart (requires 'K :> key and 'V :> value)
static member Bar : data:seq<#key * #value> * ?Labels:seq<string> * ?Options:Options -> GoogleChart
static member Bubble : data:seq<string * #value * #value * #value * #value> * ?Labels:seq<string> * ?Options:Options -> GoogleChart
static member Bubble : data:seq<string * #value * #value * #value> * ?Labels:seq<string> * ?Options:Options -> GoogleChart
static member Bubble : data:seq<string * #value * #value> * ?Labels:seq<string> * ?Options:Options -> GoogleChart
static member Calendar : data:seq<DateTime * #value> * ?Labels:seq<string> * ?Options:Options -> GoogleChart
...
Full name: XPlot.GoogleCharts.Chart
static member Chart.Line : data:Series<'K,#value> * ?Labels:seq<string> * ?Options:Options -> GoogleChart (requires equality and 'K :> key)
static member Chart.Line : data:seq<Series<'K,#value>> * ?Labels:seq<string> * ?Options:Options -> GoogleChart (requires equality and 'K :> key)
static member Chart.Line : data:seq<#seq<'K * 'V>> * ?Labels:seq<string> * ?Options:Options -> GoogleChart (requires 'K :> key and 'V :> value)
static member Chart.Line : data:seq<#key * #value> * ?Labels:seq<string> * ?Options:Options -> GoogleChart
type Options =
new : unit -> Options
member ShouldSerializeaggregationTarget : unit -> bool
member ShouldSerializeallValuesSuffix : unit -> bool
member ShouldSerializeallowHtml : unit -> bool
member ShouldSerializealternatingRowStyle : unit -> bool
member ShouldSerializeanimation : unit -> bool
member ShouldSerializeannotations : unit -> bool
member ShouldSerializeannotationsWidth : unit -> bool
member ShouldSerializeareaOpacity : unit -> bool
member ShouldSerializeavoidOverlappingGridLines : unit -> bool
...
Full name: XPlot.GoogleCharts.Configuration.Options
--------------------
new : unit -> Options
type Legend =
new : unit -> Legend
member ShouldSerializealignment : unit -> bool
member ShouldSerializemaxLines : unit -> bool
member ShouldSerializenumberFormat : unit -> bool
member ShouldSerializeposition : unit -> bool
member ShouldSerializetextStyle : unit -> bool
member alignment : string
member maxLines : int
member numberFormat : string
member position : string
...
Full name: XPlot.GoogleCharts.Configuration.Legend
--------------------
new : unit -> Legend
union case Table.Table: string [,] -> Table
--------------------
type Table = | Table of string [,]
Full name: Fslab-ionide.Table
val string : value:'T -> string
Full name: Microsoft.FSharp.Core.Operators.string
--------------------
type string = System.String
Full name: Microsoft.FSharp.Core.string
Full name: Microsoft.FSharp.Compiler.Interactive.Settings.fsi
from Microsoft.FSharp.Core
Full name: Microsoft.FSharp.Core.String.concat
val seq : sequence:seq<'T> -> seq<'T>
Full name: Microsoft.FSharp.Core.Operators.seq
--------------------
type seq<'T> = System.Collections.Generic.IEnumerable<'T>
Full name: Microsoft.FSharp.Collections.seq<_>
Full name: Fslab-ionide.table
Full name: Microsoft.FSharp.Core.ExtraTopLevelOperators.array2D
Published: Wednesday, 6 July 2016, 5:03 PM
Author: Tomas Petricek
Typos: Send me a pull request!
Tags: f#, fslab, data science