The Gamma and Digital News Innovation Fund
Last year, I wrote a bit about my interest in building programming tools for data journalism. Data journalism might sound like a niche field, but that is not the case if we talk about data-driven storytelling more generally,
In programming, your outcome is typically some application that does stuff. In data science, your outcome is very often a report or a story that aims to influence people's behavior or company decisions. No matter whether you are a journalist writing an article about government spending or an analyst producing internal sales reports, you are telling stories with data.
Being able to tell stories with data (but also verify and assess other people's stories that can be backed by data) is becoming a vital skill in the modern world, which is partly why I find this topic extremely important and interesting. But to do this currently, you need to be a skilled programmer, great designer and good storyteller, all at the same time!
I have not written about this topic much over the last year (mainly because I was busy with Coeffects, fsharpConf, FsLab and fsharpWorks), but this will be changing - I'm very happy to announce that my data-journalism related project The Gamma has been awarded funding from the DNI Innovation Fund and I'll be working on it over the next year at the Alan Turing Institute in London.
Why is data-driven storytelling hard
A nice recent example of data-driven storytelling is the New York Times story A Visual History of Which Countries Have Dominated the Summer Olympics. It uses data to tell an interesting history - but it also uses an elegant visualization that makes you immediately wonder about a number of aspects of the history (what happened in the two gaps and what are the two spikes in 1980s). It is also a fairly typical example of how hard it is to build a good data-driven story (and not many can match the work of New York Times).
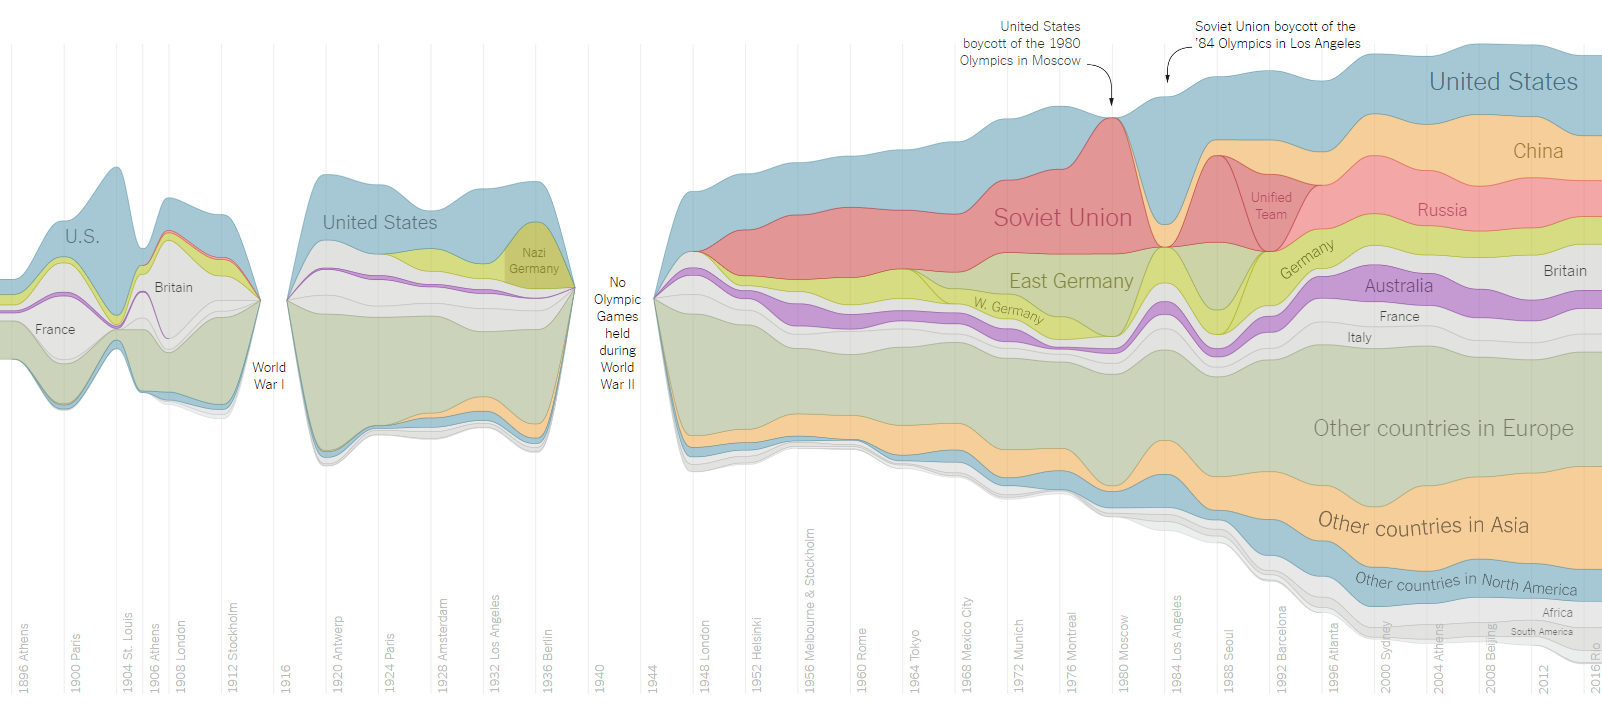
There is a number of reasons why doing something like the above New York Times data analysis and visualization is far from easy. The concrete example illustrates this quite clearly:
-
Getting the data in the first place - The New York Times article quotes Sports Reference as the source, but it is not clear how exactly they got the data. Sports Reference seems to have data for individual Olympic games in reasonable HTML tables that you could scrape. It does not have data for Rio 2016, so you'd need to scrape Rio 2016 results and match slightly different naming of disciplines...
-
The neat visualization you can see above is a D3 Streamgraph, so once you have the data (downloaded using, say, Python) you'll need to write some JavaScript to build the visualization. This typically involves modifying existing samples, because writing D3 from scratch is fairly hard.
-
If you scroll down on the New York Times visualization page, you'll find a number of other variations on the visualization that display medals by different disciplines. You'll probably need to write some more code to partition the data by disciplines - and even then, you cannot easily let the reader choose which disciplines they're interested in, because that would involve turning the static page into (even harder to create) interactive visualization.
The Gamma project proposal
For some time now, I was thinking that building such data-driven stories should be easier with a more advanced programming language and library support. Most programming tools have been created by programmers for programmers - and we often miss many great usability ideas that come from different worlds like Excel and spreadsheet programming.
I will be writing more about this over the next few months, starting with my most recent work on Visualizing Olympic Medalists, but I wanted to start by sharing the important parts of my DNI Innovation Fund application - the short summary of what I will be working on is:
Increasing number of journalists back their stories with data available through open government data efforts, international organizations and citizen initiatives. The typical way of using such data involves a number of manual steps – a data journalist might download the data using a web browser, filter it using a spreadsheet application, produce a chart and embed the result in an article as an image. Such articles suffer from a number of issues:
- They are error-prone (it is easy to make mistakes when processing data by hand)
- They are not transparent (readers cannot verify what data is used and how)
- They limit further exploration (readers cannot modify the article to explore other features)
Those issues arise from one key problem: the link between the article and the original data source is lost during the process. The aim of The Gamma Project is to create open tools that help data journalists back stories with data in a way that keeps the link between the article and the data sources. This will make data journalism more transparent and reproducible, but also more engaging for the reader as it allows new kinds of interactions with articles and data behind them.
As you can see, the original proposal was mainly focused on openness and reproducibility. I expect that this will still be the main part, but I would also like to work more on usability (making the tools easier to use for non-programmers) and I recently got interested in making interactive visualizations easier (more declarative and compositional).
What makes the project innovative
The next question in the DNI Innovation Fund application was "What makes the project innovative?" I think there is a number of reasons why there is no tool that would make the above possible. Perhaps most importantly, much of programming language research focuses on programs. We create type systems that can check program correctness, we wonder about better ways of structuring programs and so on.
In data journalism (and data science generally), much of the work is done in a scripting mode and so we need to focus more on interaction. And as I said before, the end result is not a program, but a story. The technical ideas that I plan to incorporate in The Gamma project (as outlined in the project proposal) are below.
Articles are text with calculations
The first innovative aspect of the project is that it treats data-driven articles as text with code. This key principle lets us create open and reproducible content, but it also means that we can use a range of program analysis methods for the benefit of transparent data journalism. For example, provenance tracking methods can be used to automatically generate data citations for each article.
Type providers for data access
The most important technological innovation that makes it possible to effortlessly access the plethora of open data sources will be based on the concept of type providers (indeed, the World Bank type provider was one of the things that made me think about data journalism in the first place). A type provider integrates external data sources as first-class components of a programming language. Together with modern editor tooling, user can navigate through data and use it in their program similarly to the way they navigate through directory structure in a file system.
Modern editor tooling
Modern software development environments (IDEs) provide a range of assistance to software developers when writing code including auto-completion and advanced navigation and search tools. However, those are rarely available in tools used by data journalists. In The Gamma Project, we aim to make such tooling available to data journalists, specifically focusing on problems that are important when building data-driven articles. In The Gamma Project, auto-completion and navigation tools will provide help when finding relevant data across multiple open data sources.
New kind of data-driven articles
To our best knowledge no existing publication provides the degree of openness that we envision for the articles created using The Gamma Project. Only a small number of media outlets publish source code for their articles (e.g. New York Times Upshot), but none of them make it a part of the article itself and aim to make it such that the reader can understand the analysis and reproduce the results without significant programming experience. We believe that the new kind of data-driven articles advocated by The Gamma can be an essential part towards increasing data literacy of the general public.
Novel user experiences
A more pragmatic innovation is that The Gamma articles enable novel kinds of user interactions, thus producing more engaging content for the readers. Based on the program analysis, we can automatically expose user interface for changing parameters of the data analysis (say, compare most expensive streets in a city, choosing the initial display based on the reader’s location). This will allow the readers to explore aspects of the data that they would not otherwise have access to. Furthermore, we intend to allow readers to share their perspectives on data, providing data backed commenting.
Conclusions
If you are interested in The Gamma project, you can follow it at @thegamma_net on Twitter and you can also find more information on thegamma.net, which also still hosts the one year old prototype that I wrote about last year and talked about at Strange Loop.
You can also expect more news on this blog. In particular, I will be writing about the project I did on Visualizing Olympic Medalists - this is an early version showing some of the ideas of what I'd like to build as part of The Gamma (with all source code available on GitHub)
Published: Wednesday, 31 August 2016, 2:38 PM
Author: Tomas Petricek
Typos: Send me a pull request!
Tags: thegamma, data journalism, programming languages