The Gamma dataviz package now available!
There were a lot of rumors recently about the death of facts and even the death of statistics. I believe the core of the problem is that working with facts is quite tedious and the results are often not particularly exciting. Social media made it extremely easy to share your own opinions in an engaging way, but what we are missing is a similarly easy and engaging way to share facts backed by data.

This is, in essence, the motivation for The Gamma project that I've been working on recently. After several experiments, including the visualization of Olympic medalists, I'm now happy to share the first reusable component based on the work that you can try and use in your data visualization projects. If you want to get started:
- Check out thegamma-script package on npm
- Minimal example of thegamma-script in action
- How to use thegamma-script in your projects
The package implements a simple scripting language that anyone can use for writing simple data aggregation and data exploration scripts. The tooling for the scripting language makes it super easy to create and modify existing data analyses. Editor auto-complete offers all available operations and a spreadsheet-inspired editor lets you create scripts without writing code - yet, you still get a transparent and reproducible script as the result.
What do you get?
I experimented with a couple of ideas when working on the project and the package implements two most interesting ones:
-
The pivot type provider - lets you write scripts to perform data aggregation using just dot (full dot-driven development!) As you are writing code, it offers the available operations, so when you type
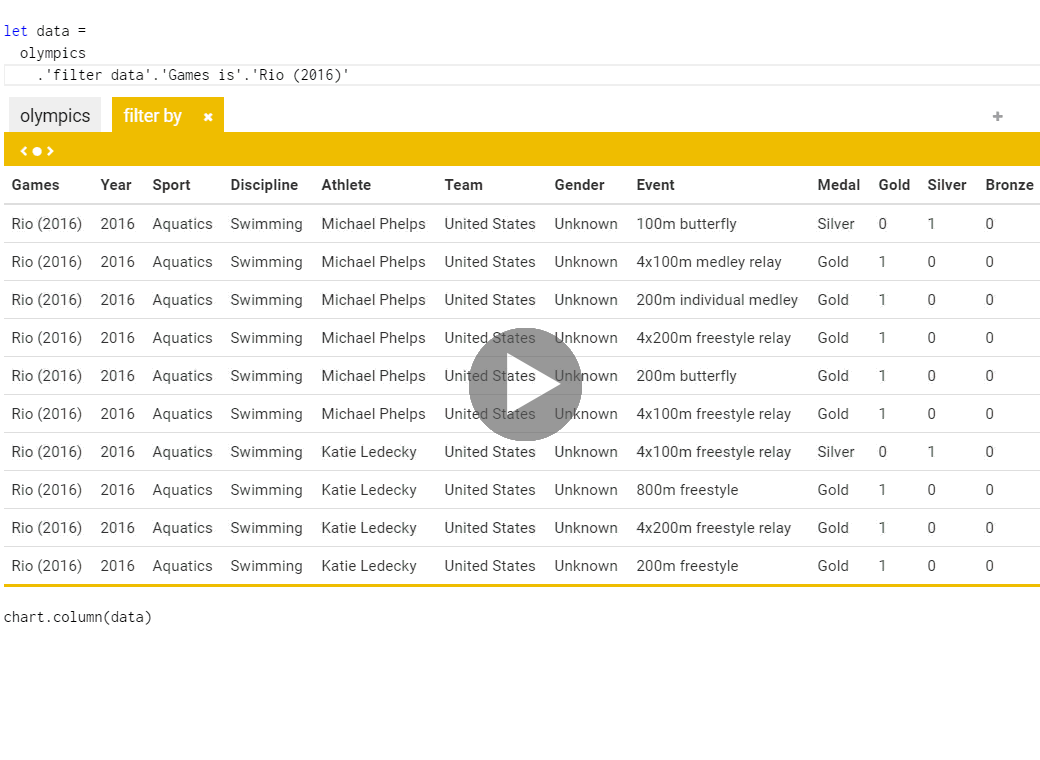
'filter data'.'Games is'.the type provider offers a list of available values including e.g.Rio (2016). This means that you do not have to learn much about programming - you just need to choose what you want to do! -
Spreadsheet-inspired editor - a nice thing about spreadsheets is that you always see concrete values you're working with. I wrote about this recently and used spreadsheets as an inspiration for an editor that is included in The Gamma package. It shows the transformed data as you write your aggregations and it also lets you change the code through a simple user interface.
The following gif shows the ideas in action. Given a data set that consists of a list of all the Olympic medal winners (which I used for the Olympic medalists project), we want to get a bar chart with top countries based on medals from Rio 2016:
The package provides an API for running The Gamma scripts and rendering the resulting chart
in a given div and it also provides an API for creating an editor that you can see in the
above gif in a given div. The currently supported charting libraries are Google
Charts (though it is possible to add more!) and
the editor uses the Monaco editor behind the
scenes.
Getting started
The easiest way to get started is to look at the developer documentation and to explore the sample web application, which is hosted live here. If you want the use The Gamma, you will need two things. First, you will need a simple REST service that provides the data for your visualizations and can execute simple queries constructed in the browser. Second, you will need to configure the JavaScript component. There is a detailed documentation for both of these on thegamma.net, but I'll briefly summarize both here.
Using the client-side component
The client-side component is available as thegamma-script
on npm. In order to use it with the Monaco editor, you
need to load it using require.js. Once it is loaded, all you need to do is to specify type
providers that define what will be available to the person writing code. Type providers provide
top-level objects such as olympics (exposing data) and chart (mapping for Google charts).
The JavaScript code looks something like this:
1: 2: 3: 4: 5: 6: 7: 8: 9: 10: |
|
The g.providers API lets you define two kinds of type providers (the third one is
work-in-progress and I'll add it to the documentation soon):
-
The
pivotprovider takes a service that can evaluate "data aggregation" requests. The demo uses a sample implementation for the Olympic medals data set. The protocol that the service exposes is documented at publishing data page. The provider automatically generates members that let you write data aggregations and transformations using.as in the demo. -
The
libraryprovider takes a JSON that specifies the types and structure of JavaScript libraries - thethegamma-scriptpackage comes with a couple of wrappers for Google Charts and for generating tables that you can see in the Olympic Medalists demo. You can create your own too, but it's not documented yet...
Once type providers are specified, you get back a context ctx which can be used to
create Monaco editor, monitor errors in the code written by users and run scripts.
Assuming the #demo element contains the script to run, you can execute it and display
the output in #out1 element using:
1: 2: |
|
The context object provides the following functions:
evaluatelets you run user code written using The Gamma script.createEditorlets you create Monaco editor for editing The Gamma code.-
errorReportedlets you register an event handler that is called code contains error. This is triggered when you run code usingevaluateor while the user edits code in the editor.
Creating editor and reporting errors as shown in the sample web demo is similarly easy to running code. The full developer documentation explains the remaining functions of the public API.
Implementing data provider
The type provider specified using g.providers.pivot takes a URL of a data source. All you
need to do to provide your own data source is to create a simple REST service (which can be
written in any language) that returns metadata about your data source and can evaluate
queries written using The Gamma.
The query evaluation is done on the server rather than the client. This lets you expose large data sets that would not be easy to download (the results of the query are typically smaller and can be truncated), but it means some more logic is needed on the server.
Assuming you specify http://example.com/olympics as your data source. When you create the type
provider, it will first make request with ?metadata query to get information about the columns
that your data set contains. The response should be a JSON record with column names as keys and
types (number or string) as values:
1:
|
|
1: 2: 3: 4: 5: |
|
This is all the pivot type provider needs to generate most of the members that are available in the auto-completion list. When you finish writing code and run it, another request is issued to get the data. For the above example where we look at Rio 2016, group data by Athlete, sum number of Gold medals for each athlete, sort the results by the number of medals, take the top 3 and then get a data series with athlete and the number of medals, the query looks as follows:
1: 2: 3: 4: |
|
1: 2: 3: |
|
As you can see, parts of the query are separated by $ and they represent the indidividual steps
of the data transformation. The part series(Athlete,Gold) at the end specifies what data we
want to get - here, we want to get the result as a series, which is a simple list of key value
pairs, stored as nested lists.
If you want to learn more, the publishing data article explains the details of the protocol and the Olympics service shows a minimal F# example that exposed data based on a CSV file. I will be adding further examples to The Gamma repository soon, but let me know at @tomaspetricek if you have some interesting data source that you'd like to support!
Summary
When I started thinking about open and transparent visualizations more than a year ago, I did not realize how timely issue this will be. I believe that we need to build much better tools for making facts backed by data more engaging. Using a phrase from my recent talk, here is what we need!

The Gamma project is still in its early days, but the thegamma-script package that you can now use is the first step towards using data in a more fun way that encourages people to explore data on their own and produce transparent and reproducible results. Thanks to the pivot type provider and the spreadsheet-inspired editor available through The Gamma, doing that should now be a lot easier!
Published: Wednesday, 25 January 2017, 1:31 PM
Author: Tomas Petricek
Typos: Send me a pull request!
Tags: thegamma, data journalism, data science, research, visualization