Creating interactive You Draw bar chart with Compost
For a long time, I've been thinking about how to design a data visualization library that would make it easier to compose charts from simple components. On the one hand, there are charting libraries like Google Charts, which offer a long list of pre-defined charts. On the other hand, there are libraries like D3.js, which let you construct any data visualization, but in a very low-level way. There is also Vega, based the idea of grammar of graphics, which is somewhere in between, but requires you to specify charts in a fairly complex language including a huge number of transformations that you need to write in JSON.
In the spirit of functional domain specific languages, I wanted to have a small number of simple but powerful primitives that can be composed by writing code in a normal programming language like F# or JavaScript, rather than using JSON.
My final motivation for working on this was the You Draw It article series by New York Times, which uses interactive charts where the reader first has to make their own guess before seeing the actual data. I wanted to recreate this, but for bar charts, when working on visualizing government spending using The Gamma.
The code for this was somewhat hidden inside The Gamma, but last month, I finally extracted all the functionality into a new stand-alone library Compost.js with simple and clean source code on GitHub and an accompanying paper draft that describes it (PDF).
In this article, I will show how to use Compost.js to implement a "You Draw" bar chart inspired by the NYT article. When loaded, all bars show the average value. You have to drag the bars to positions that you believe represent the actual values. Once you do this, you can click "Show me how I did" and the chart will animate to show the actual data, revealing how good your guess was. Before looking at the code, you can have a look at the resulting interactive chart, showing the top 5 areas from the 2015 UK budget (in % of GDP):
Published: Thursday, 16 July 2020, 11:20 PM
Tags:
functional, functional programming, data science, thegamma, data journalism, visualization
Read the complete article
Getting started with The Gamma just got easier
Over the last year, I have been working on The Gamma project, which aims to make data-driven visualizations more trustworthy and to enable large number of people to build visualizations backed by data. The Gamma makes it possible to create visualizations that are built on trustworthy primary data sources such as the World Bank and you can provide your own data source by writing a REST service.
A great piece of feedback that I got when talking about The Gamma is that this is a nice ultimate goal, but it makes it hard for people to start with The Gamma. If you do not want to use the World Bank data and you're not a developer to write your own REST service, how do you get started?
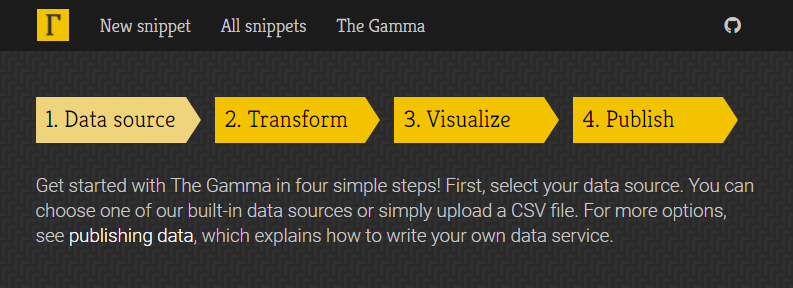
To make starting with The Gamma easier, the gallery now has a new four-step getting started page where you can upload your data as a CSV file or paste it from Excel spreadsheet and create nice visualizations that let your reader explore other aspects of the data.
Head over to The Gamma Gallery to check it out or continue reading to learn more about creating your first The Gamma visualization...
Published: Wednesday, 14 June 2017, 2:27 PM
Tags:
thegamma, data journalism, data science, research, visualization
Read the complete article
The Gamma dataviz package now available!
There were a lot of rumors recently about the death of facts and even the death of statistics. I believe the core of the problem is that working with facts is quite tedious and the results are often not particularly exciting. Social media made it extremely easy to share your own opinions in an engaging way, but what we are missing is a similarly easy and engaging way to share facts backed by data.

This is, in essence, the motivation for The Gamma project that I've been working on recently. After several experiments, including the visualization of Olympic medalists, I'm now happy to share the first reusable component based on the work that you can try and use in your data visualization projects. If you want to get started:
- Check out thegamma-script package on npm
- Minimal example of thegamma-script in action
- How to use thegamma-script in your projects
The package implements a simple scripting language that anyone can use for writing simple data aggregation and data exploration scripts. The tooling for the scripting language makes it super easy to create and modify existing data analyses. Editor auto-complete offers all available operations and a spreadsheet-inspired editor lets you create scripts without writing code - yet, you still get a transparent and reproducible script as the result.
Published: Wednesday, 25 January 2017, 1:31 PM
Tags:
thegamma, data journalism, data science, research, visualization
Read the complete article
Happy New Year 2016 around the World: Behind the scenes of my #FsAdvent project
Just like last year and the year before, I wanted to participate in the #FsAdvent event, where someone writes a blog post about something they did with F# during December. Thanks to Sergey Tihon for the organization of the English version and the Japanese F# community for coming up with the idea a few years ago!
As my blog post ended up on 31 December, I wanted to do something that would fit well with the theme of ending of 2015 and starting of the new year 2016 and so I decided to write a little interactive web site that tracks the "Happy New Year" tweets live across the globe. This is partly inspired by Happy New Year Tweets from Twitter in 2014, but rather than analyzing data in retrospect, you can watch 2016 come live!
Published: Wednesday, 30 December 2015, 7:09 PM
Tags:
f#, data journalism, thegamma, data science, visualization
Read the complete article