Visualizing interesting world facts with FsLab
In case you missed my recent official FsLab announcement, FsLab is a data-science package for .NET built around F# that makes it easy to get data using type providers, analyze them interactively (with great R integration) and visualize the results. You can find more on on fslab.org, which also has links to some videos and download page with templates and other instructions.
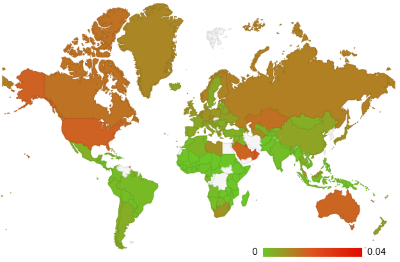
Last time, I mentioned that we are working on integrating FsLab with the XPlot charting library. XPlot is a wonderful F# library built by Taha Hachana that wraps two powerful HTML5 visualization libraries - Google Charts and plot.ly.
I thought I'd see what interesting visualizations I can built with XPlot, so I opened the World Bank type provider to get some data about the world and Euro area, to make the blog post relevant to what is happening in the world today.
Published: Tuesday, 30 June 2015, 5:07 PM
Tags:
f#, fslab, data science, data journalism, thegamma
Read the complete article