Getting started with The Gamma just got easier
Over the last year, I have been working on The Gamma project, which aims to make data-driven visualizations more trustworthy and to enable large number of people to build visualizations backed by data. The Gamma makes it possible to create visualizations that are built on trustworthy primary data sources such as the World Bank and you can provide your own data source by writing a REST service.
A great piece of feedback that I got when talking about The Gamma is that this is a nice ultimate goal, but it makes it hard for people to start with The Gamma. If you do not want to use the World Bank data and you're not a developer to write your own REST service, how do you get started?
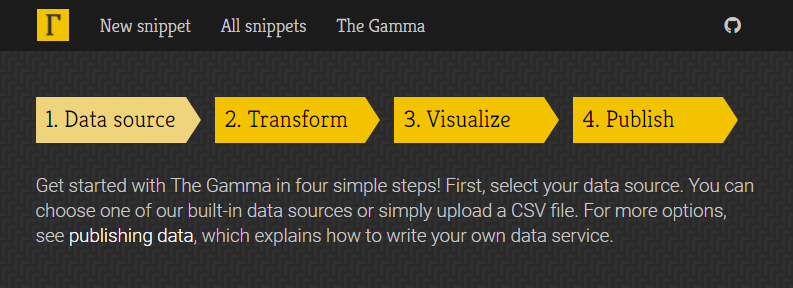
To make starting with The Gamma easier, the gallery now has a new four-step getting started page where you can upload your data as a CSV file or paste it from Excel spreadsheet and create nice visualizations that let your reader explore other aspects of the data.
Head over to The Gamma Gallery to check it out or continue reading to learn more about creating your first The Gamma visualization...
Published: Wednesday, 14 June 2017, 2:27 PM
Tags:
thegamma, data journalism, data science, research, visualization
Read the complete article